Ancestral Chart Challenge

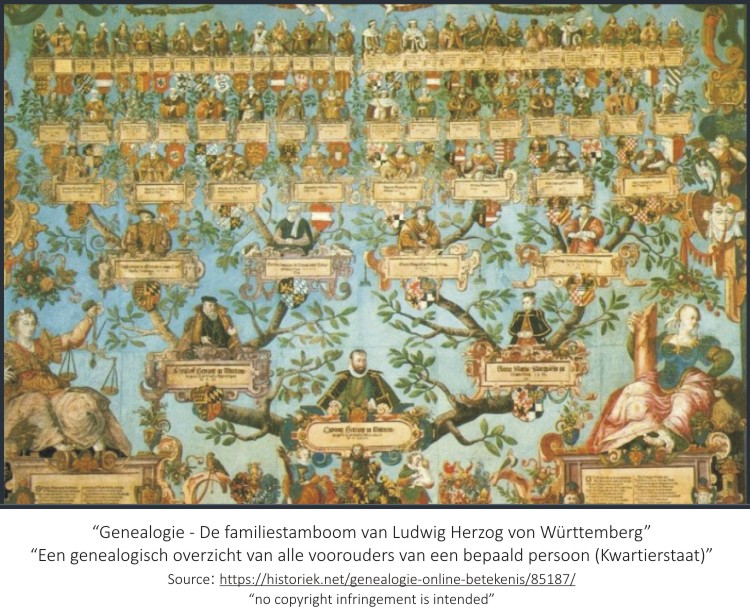
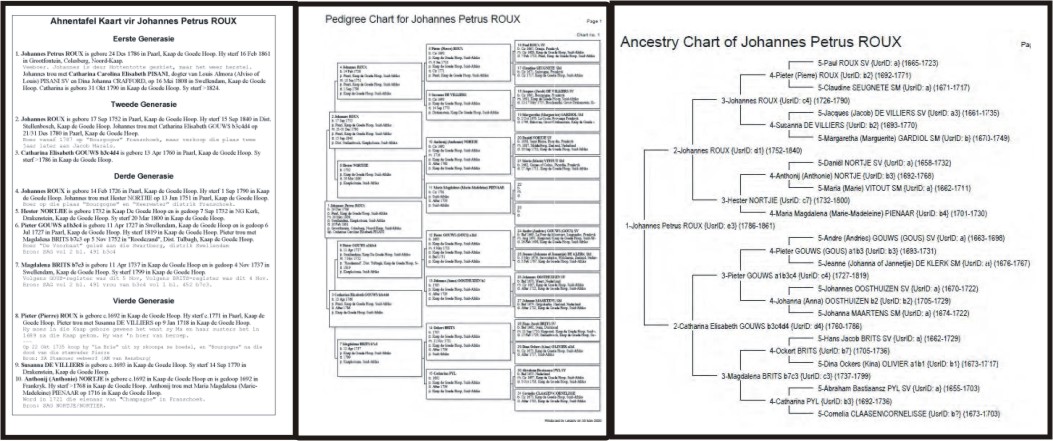
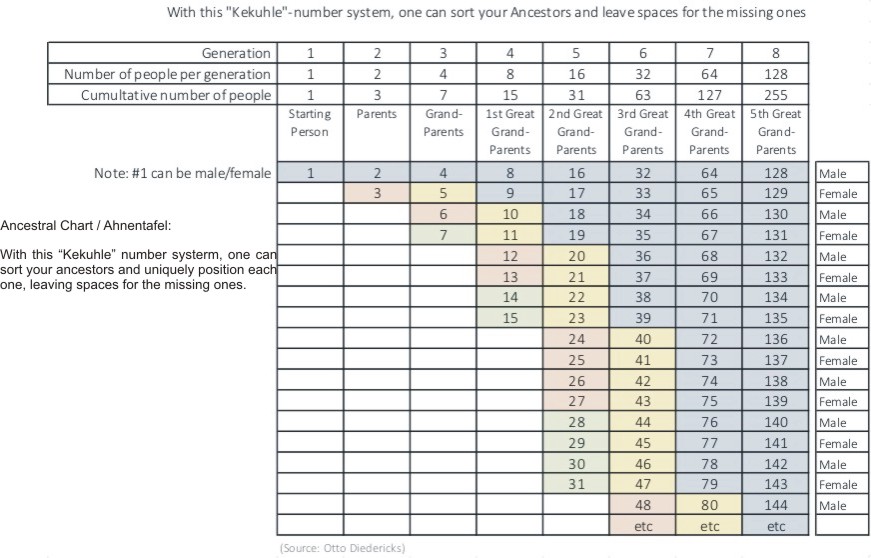
The “ancestral chart” / “pedigree chart” together with an “Ahnentafel” report are suitable formats to document family lineage and  history. It is available in most genealogical software packages, such as Legacy, MyHeritage and RootsMagic. Below some clarification of the Concepts, Examples (which can also be downloaded together with a blank set of MSWord forms) and a nifty Planning Tool.
Having invited Gauteng North Branch members to submit their ancestral chart, we now expand GSSA’s Ancestral Chart project with a challenge to all other members of the society and genealogy researchers.
This project aims to document, share and preserve as much data of South African families as possible. In this way, the current South African Family Registers (SAF) will also be updated.

Choose to take part – it is entirely voluntary

  • Data will be kept confidential within the Genealogy community
  • Participation is not confined to GSSA branch members. Send this to your friends and acquaintances
  • Select any #1 person (yourself, an ancestor, whomever) for your ancestral charts
  • Commit to document at least 5 generations (31 individuals) or more

(Extensions and additions can still be submitted later)

  • MS Word document
  • MS Excel file
  • PDF document
  • Genealogy file, preferably exported to GedCom format

(Submit the Ancestral Chart and/or the entire database for safekeeping along with accompanying document(s))

  • Remember to list bibliography and sources, where applicable.

Submit your results by email to This email address is being protected from spambots. You need JavaScript enabled to view it.on or before 31 May, or otherwise 30 November.

Ancestral Chart Concepts

The underlying premise of an ancestral chart is that every person has a biological/adopted father and mother. This is predictable and certain, generation after generation. These charts typically use Ahnentafel”-numbers (German for pedigree numbers, devised by Michaël Eytzinger, an Austrian historian who published the system in 1590) to cater for the exponential growth in the numbers of people as generations increase. (https://thatsmaths.com/2015/11/12/numbering-the-family-tree/).  This numbering system provides a systematic way to uniquely identify people and position them in the family structure, even if nothing else but their number is known initially. (See also https://familypedia.wikia.org/wiki/Ahnentafel )
An ancestral chart starts with a descendent or selected person, male or female, which becomes the base person, #1 - the first generation.  This person can be yourself, an ancestor, or any person you may be interested in.
  • Person #1 has a father (#2) and a mother (#3)
  • Person #2 has a father (#4) and a mother (#5)
  • Person #3 has a father (#6) and a mother (#7)

There is a rhythm to the numbering system: The base person is number 1; his/her father is given double this number and his/her mother double-plus-one; and this process can be repeated generation after generation.  Males therefore always have an even number and females have odd numbers.  The number of people double in every generation – leading to an exponential growth curve:

  • Generation 1 - 1 person - #1
  • Generation 2 - 2 people - #2, #3
  • Generation 3 - 4 people - #4, #5, #6, #7
  • Generation 4 - 8 people - #8, #9, #10, #11, #12, #13, #14, #15

Planning Tool


Ancestral Chart